Before you start
Both reports need the Reports add-on. Lead Hand-offs also needs the Sales Pipeline add-on, because it reads who claimed and unclaimed each lead on the pipeline.
| Report | Where | Who can open it |
|---|---|---|
| Sales Performance | Reports menu | Admins and marketing managers |
| Lead Hand-offs | Reports menu | Admins |
A sales rep’s credit comes from the move’s sales commission. Whoever holds the commission on a move is the rep the report counts it for. A lead nobody has claimed shows on an Unassigned row.
Pick the month and the date
Open Reports, then Sales Performance. Three pickers sit at the top right.
- Pick which date puts a move in the month. Sale Date (the default) counts a move in the month it was booked. Move Date counts it in the month the move happens. Lead Creation Date counts it in the month the lead came in.
- Pick the month and the year.
While you look at the current month, a Report Not Final note says the numbers can still change. They settle once the month ends.
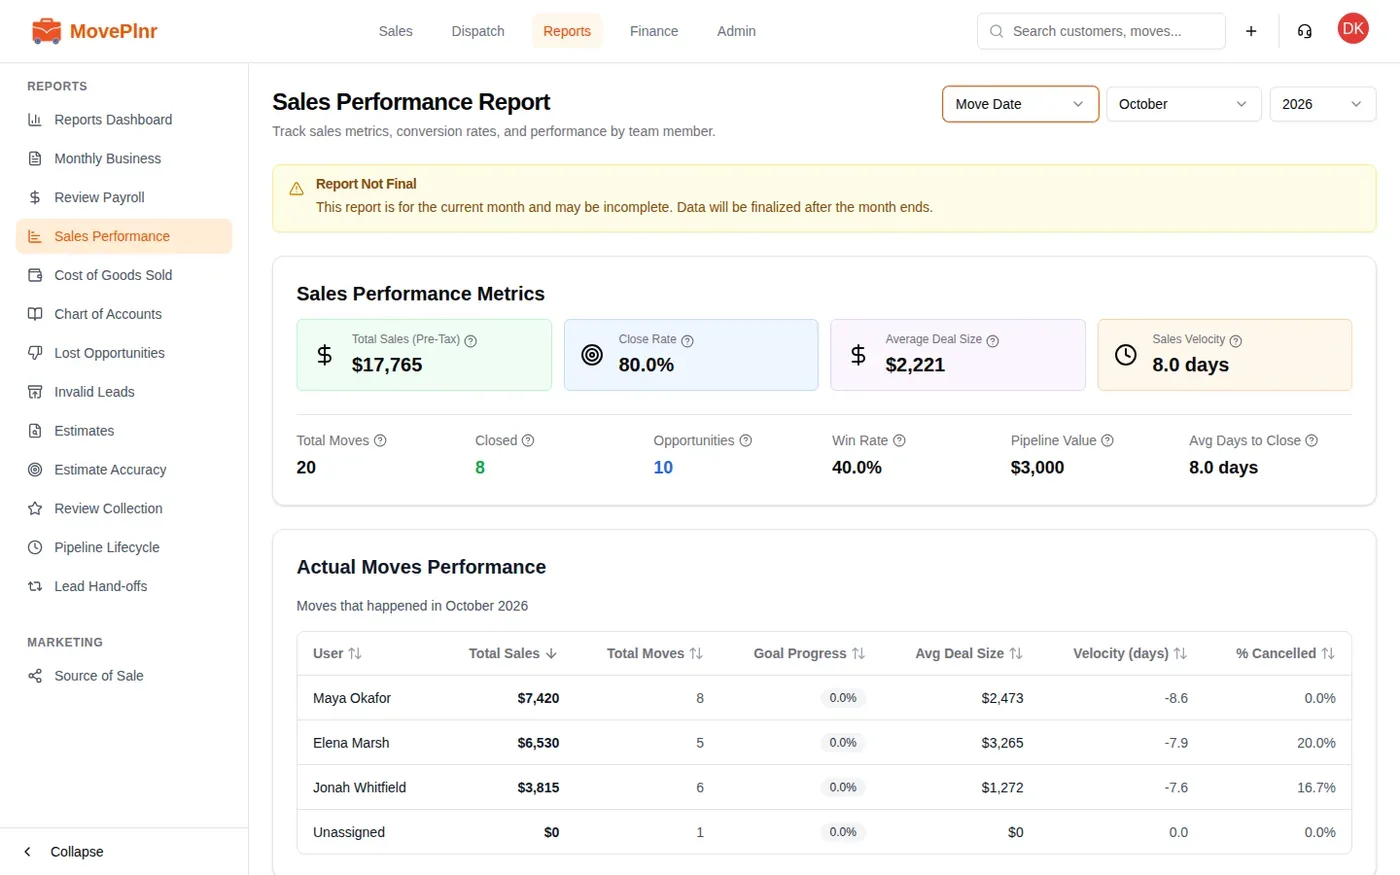
The metrics card adds up the month:
- Total Sales (Pre-Tax): what your closed moves brought in, before tax.
- Close Rate: closed moves out of all the moves that finished, closed or cancelled.
- Average Deal Size: total sales divided by the closed moves.
- Sales Velocity: the average number of days between the sale and the move. Avg Days to Close shows the same number.
- Total Moves, Closed and Opportunities: every move in the month, the closed ones, and the ones still open (a lead, booked, or waiting on a signature).
- Win Rate: closed moves out of the leads that came in this month.
- Pipeline Value: the low end of the estimate on every open move.
Point at the question mark beside any number to see what it counts.
Read each rep’s numbers
Actual Moves Performance has one row per rep for the moves in the month: Total Sales, Total Moves, Goal Progress, Avg Deal Size, Velocity (days) and % Cancelled. Click a column heading to sort by it, and click again to flip the order.
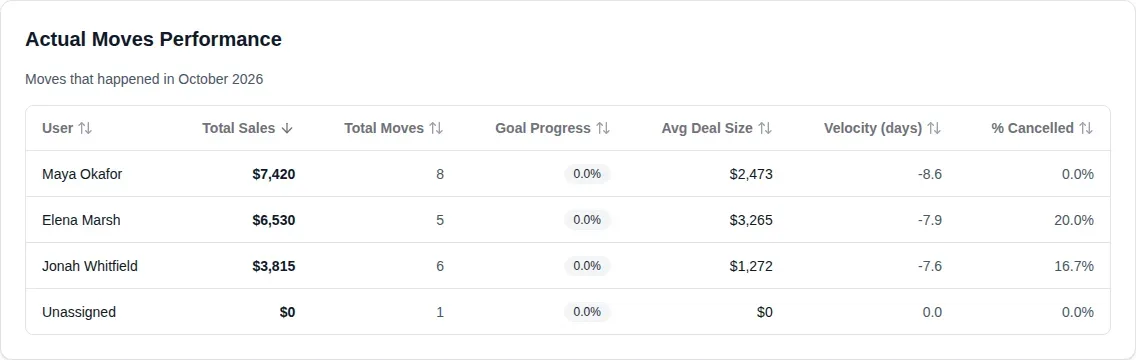
Velocity on a rep’s row keeps its sign: a negative number means the move happened before the sale was recorded.
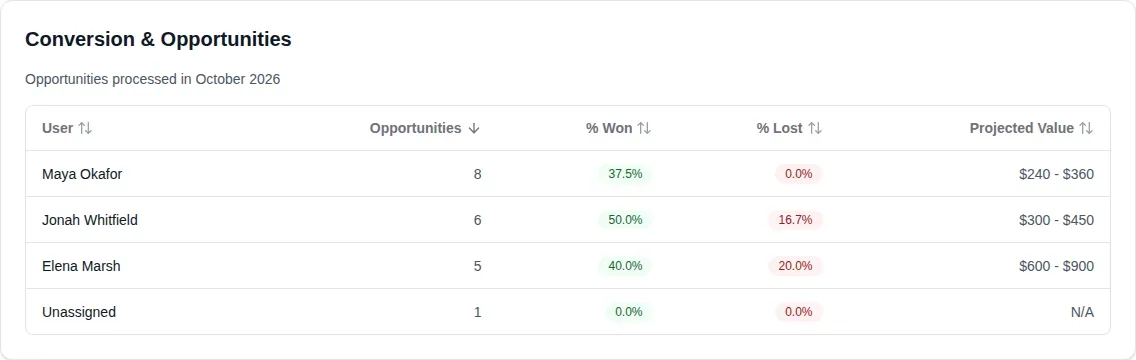
Conversion & Opportunities looks at the same reps from the lead side: how many opportunities each rep handled, the share they won and lost, and the value of what they still have open.
Find a booking on the calendar
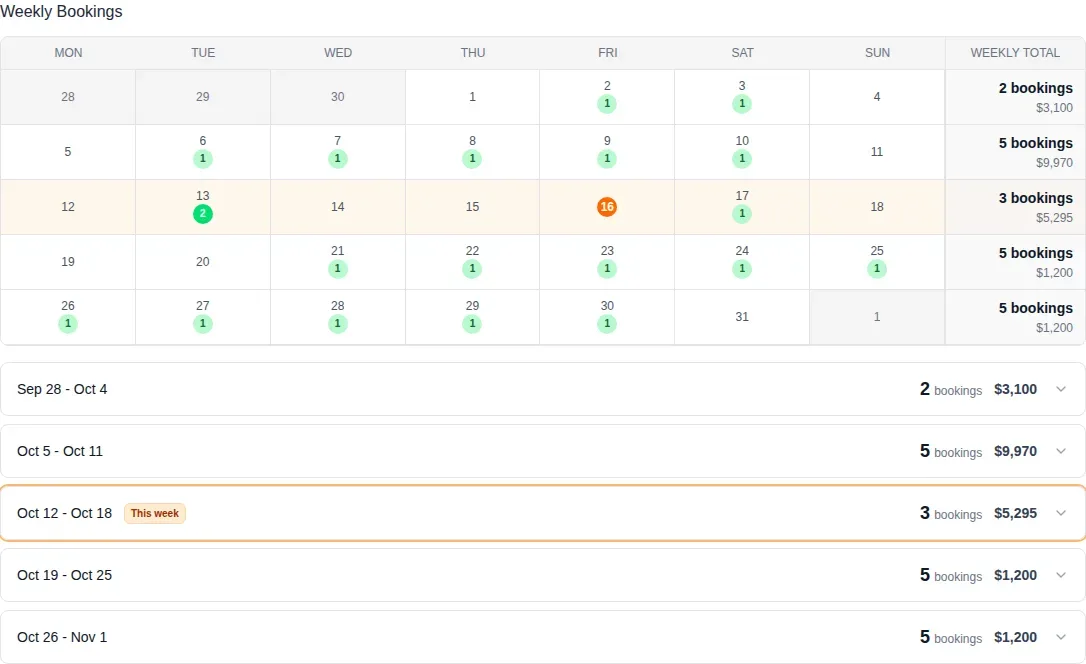
Under Booked Moves Details, Weekly Bookings lays the month out as a calendar. Weeks run Monday to Sunday, the week you are in is highlighted, and the weekly total on the right adds up each week.
- Find a day with a green number. The number is how many moves fall on that day.
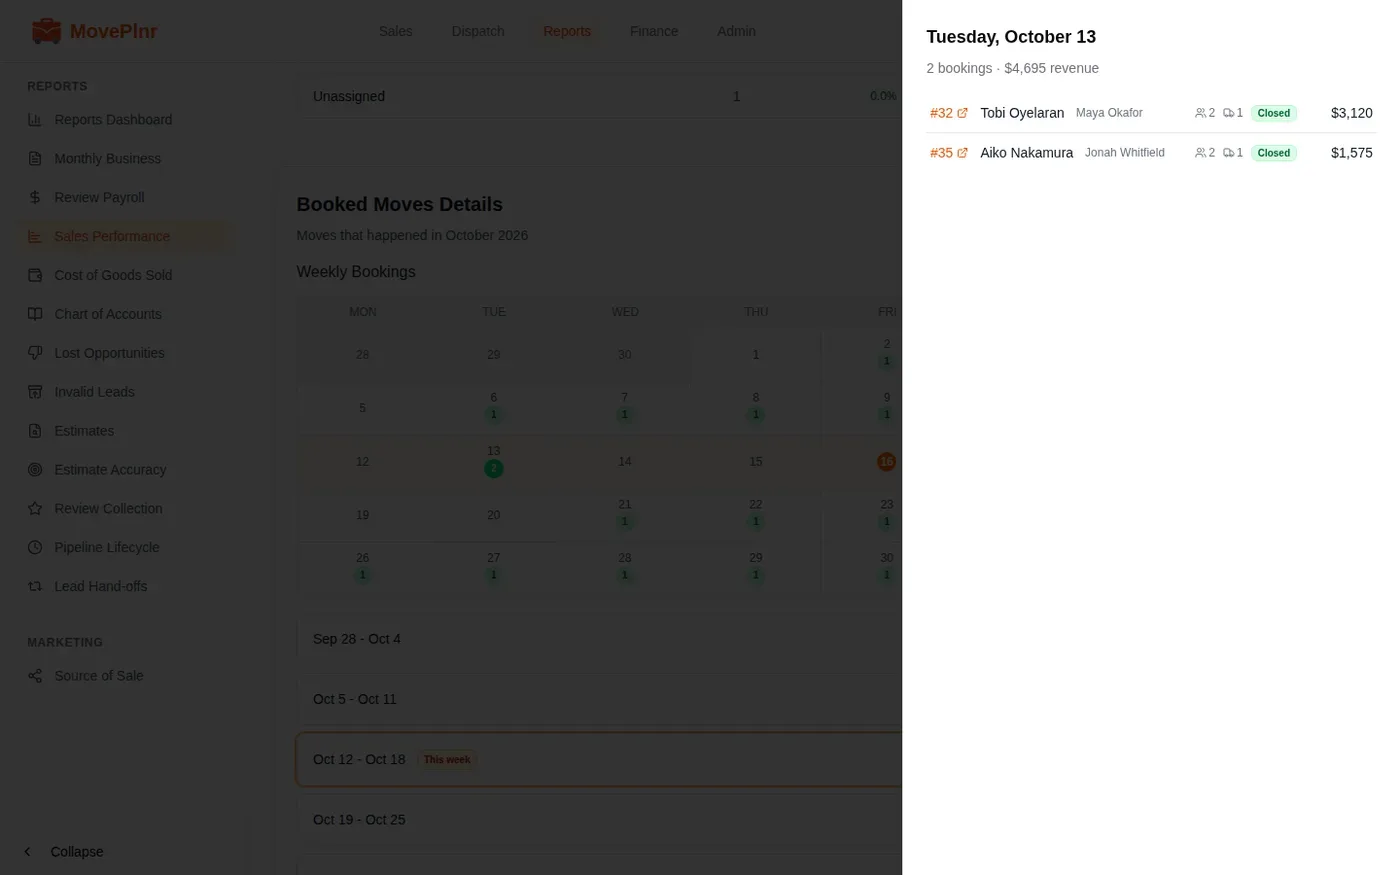
- Click the number. A panel opens with that day’s moves: the customer, the rep, the crew and trucks, the status and the value.
- Click a move number in the panel to open the move in a new tab.
One rep’s week
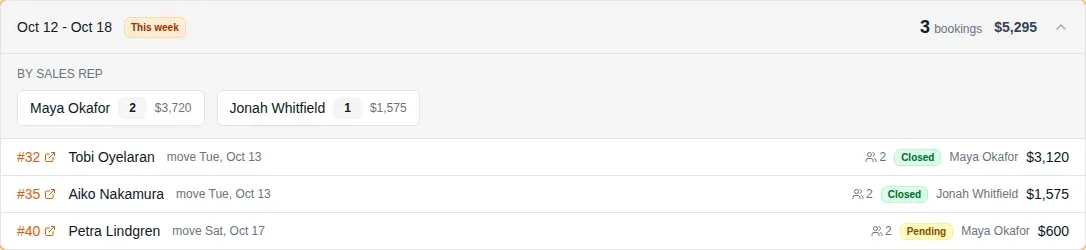
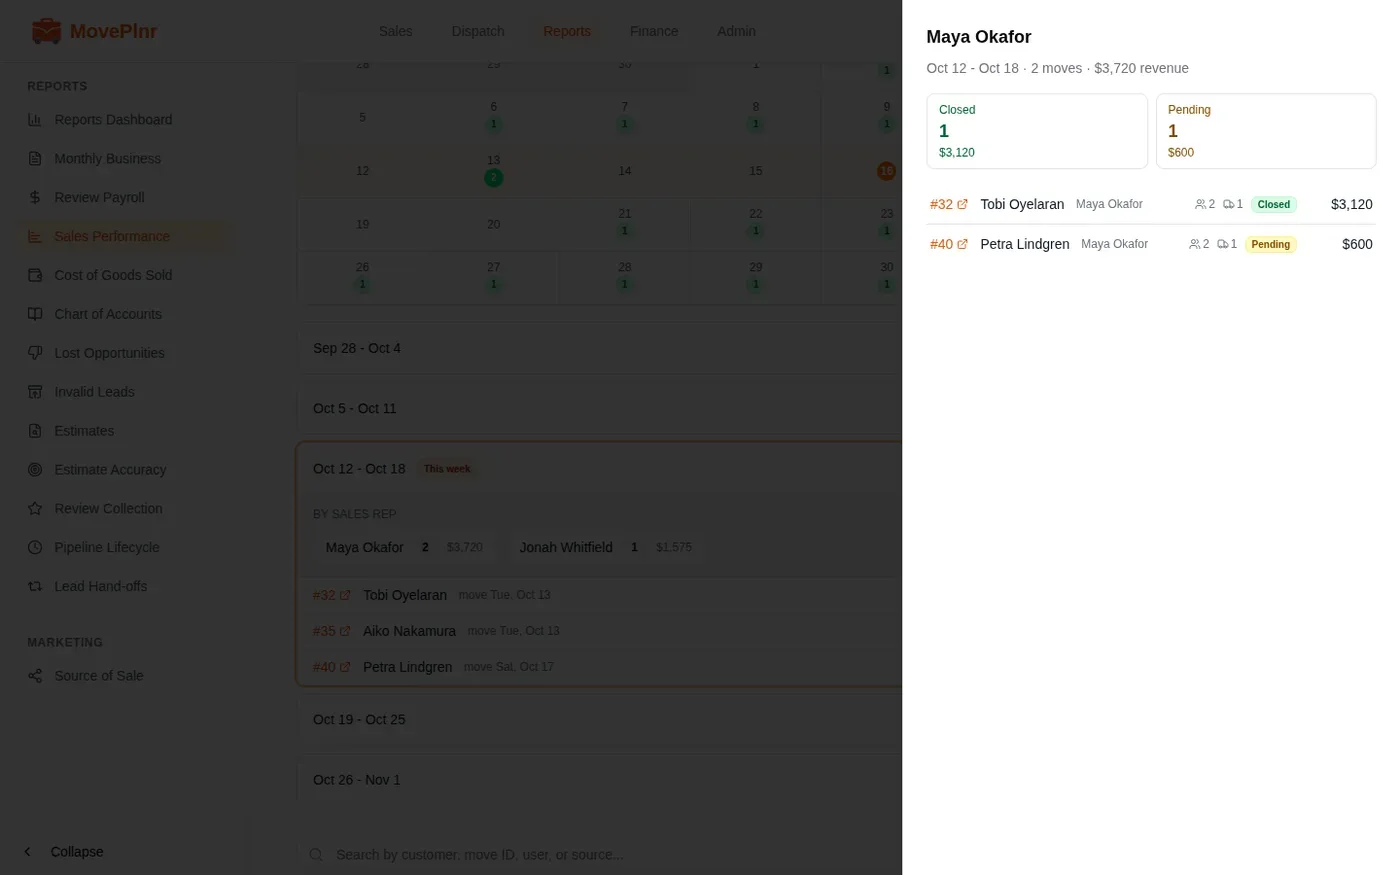
Below the calendar, each week has its own row with its bookings and value. Click a week to open it. You see the week’s moves and a button for every rep who has one. Click a rep’s name to open their week: a tile for each status with the count and the value, then every move.
Cancelled moves count as bookings in the calendar but never add to its revenue.
Dig into the move lists
Booked Moves Details ends with a list of the month’s moves, and Opportunities Details lists the leads that came in during the month and how they turned out. Both lists have a search box and filters for status, sales rep and source, and the moves list can also filter by location. Both have Download CSV.
To narrow a list to part of the month, click Full month. Pick a week from the quick list, or click two days on the calendar for your own range, then click Done. Reset goes back to the whole month.
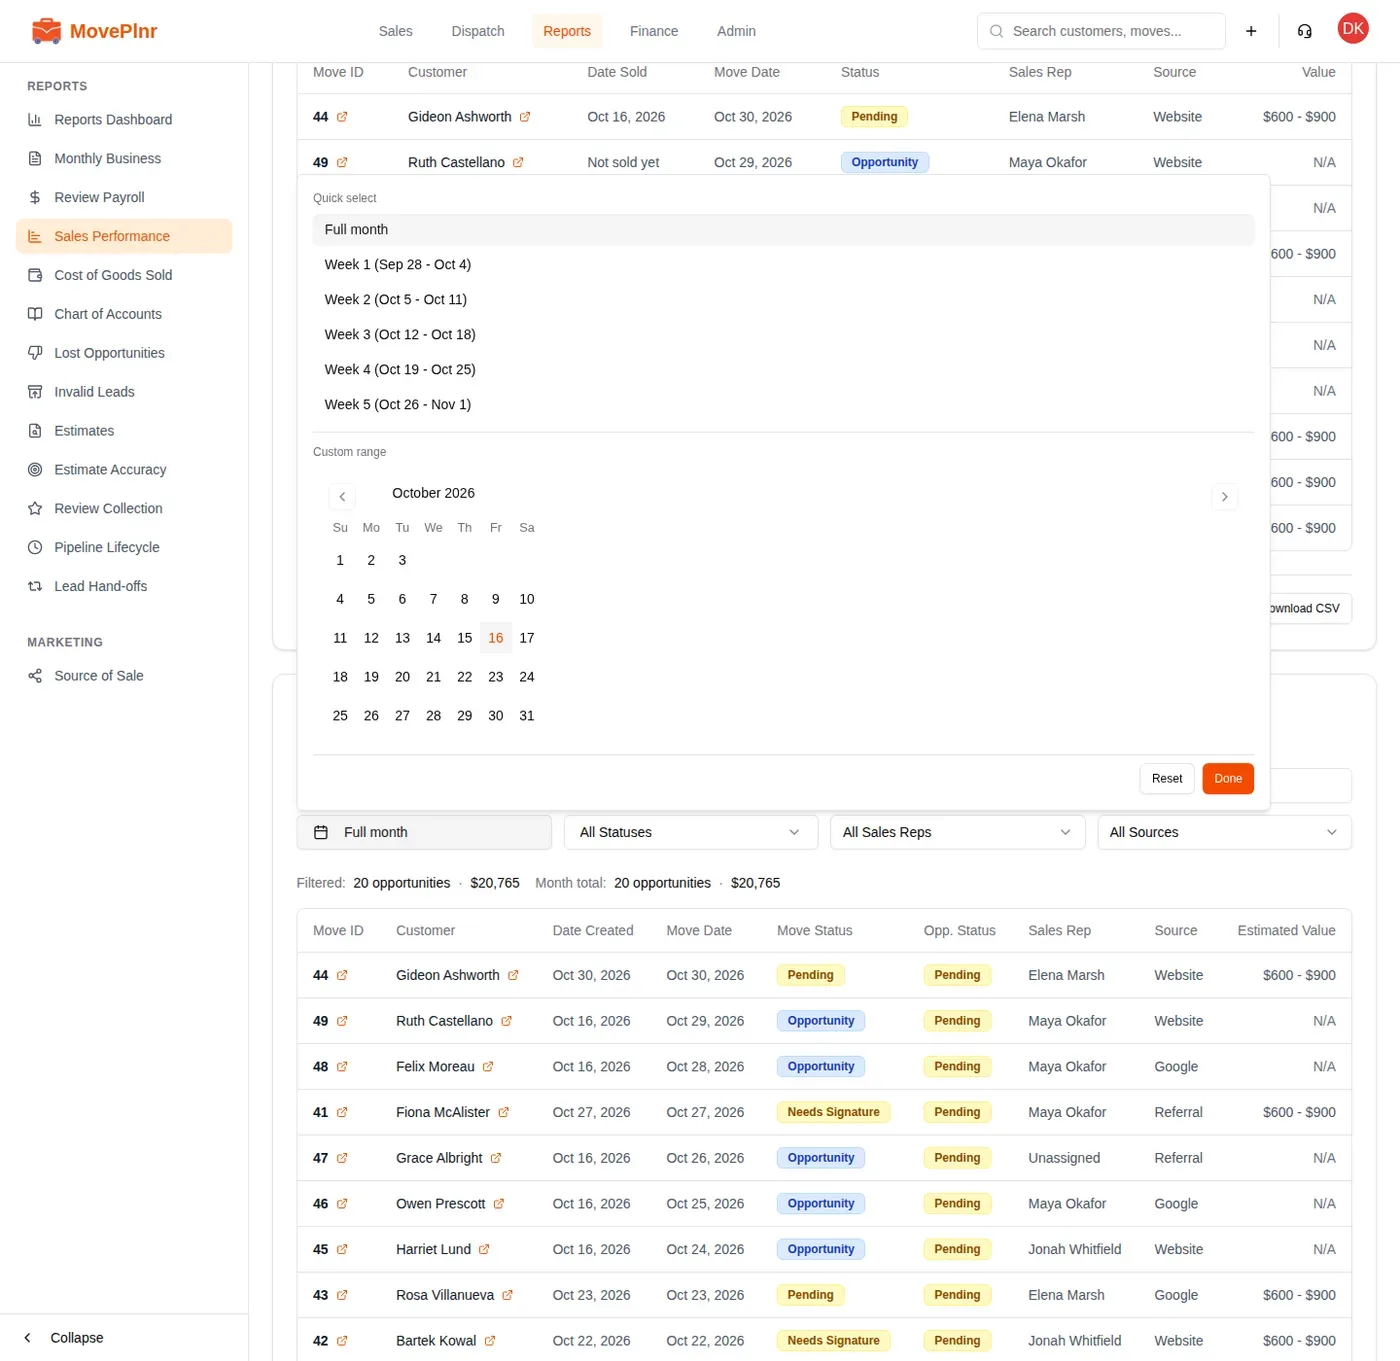
The two lines above each list show the total for what you filtered and the total for the month, so you can see how much of the month a filter covers.
See which leads changed hands
Lead Hand-offs answers three questions: who lets leads go, who picks them up, and whether the leads they pick up get booked. Open Reports, then Lead Hand-offs. It opens on Last 3 Months; change the range or the branch at the top right.
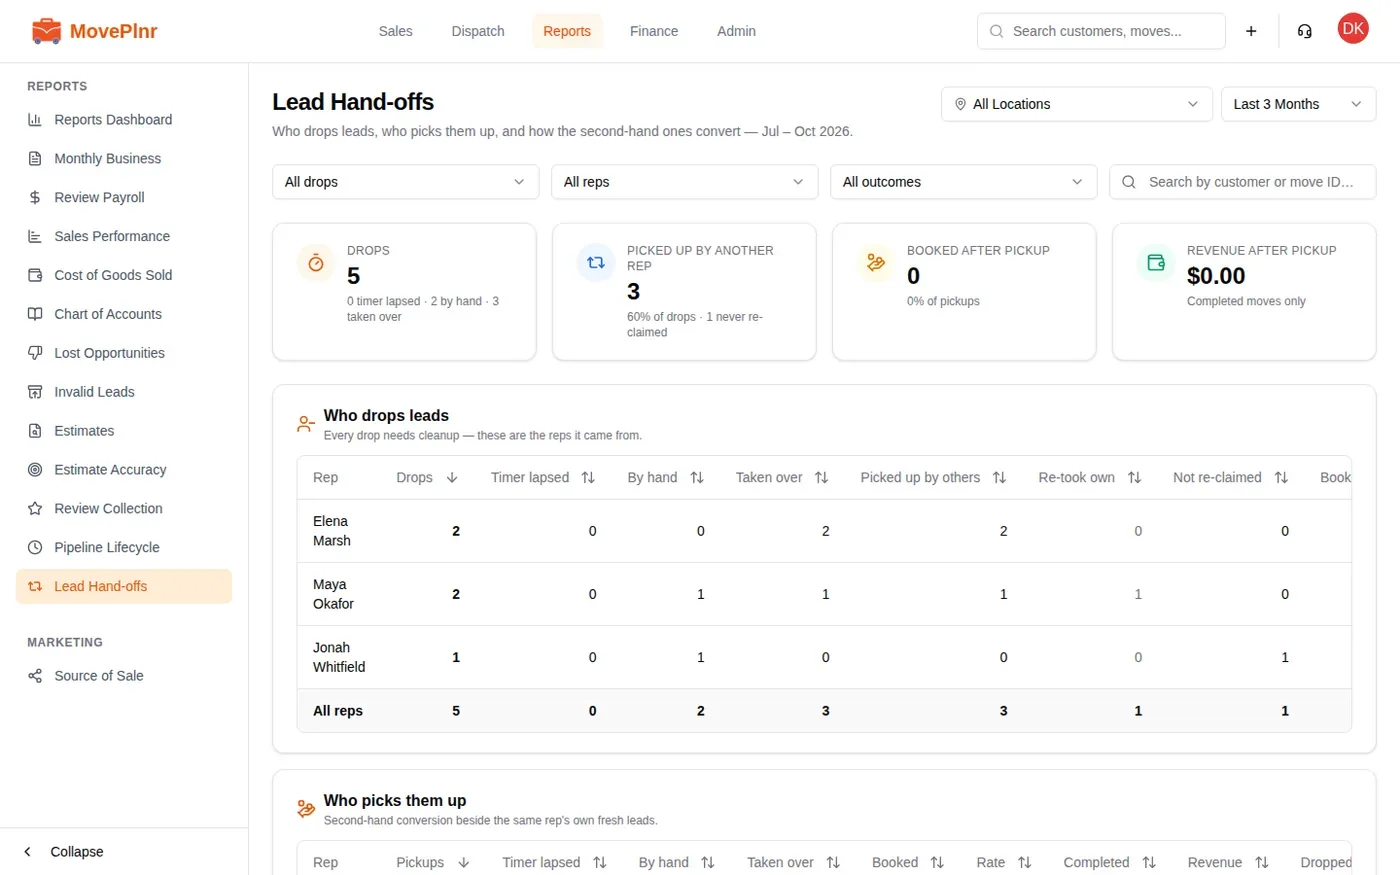
A drop is any time a lead stops being a rep’s. There are four kinds, and the first filter picks between them:
- Timer lapsed: the rep’s follow-up time ran out and the lead went back to the pipeline.
- Unclaimed by hand: the rep let the lead go.
- Taken over: another rep claimed the lead.
- Reassigned by manager: a manager gave the lead to someone else. The table names the manager under the rep.
The four tiles count the drops, the drops another rep picked up, the pickups that turned into a booking, and the revenue from those bookings once the move is complete.
Who drops leads has one row per rep who let a lead go, with each kind of drop and what happened next: picked up by others, re-took own, or not re-claimed. Who picks them up shows the reps who took those leads, how many they booked, and their rate beside the rate on their own fresh leads. Click a row in either table to see the drops behind it.
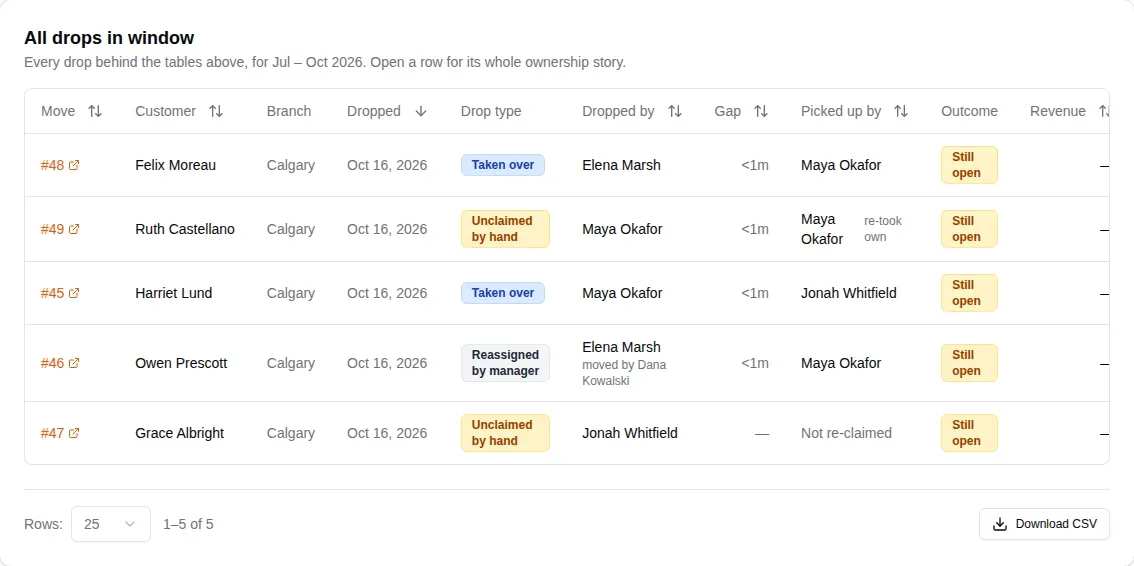
All drops in window lists every drop: the customer, when it was dropped, the kind of drop, who dropped it, how long it sat, who picked it up and how it ended. Open a row for the lead’s whole ownership story. Download CSV takes the list with you.