
Before you start
Daily Reports needs the Sales Pipeline add-on. An admin turns the reports on in Other Settings, under Feature Toggles: switch on Daily Reports. Once it is on, every sales rep gets a report for each day they work.

| Page | Where | Who can open it |
|---|---|---|
| Daily Reports dashboard | Reports menu | Admins and sales reps |
| Daily Reports (your own) | Sales menu | Sales reps |
| Monthly Business Report | Reports menu, Monthly Business | Admins |
| TV Link settings | Company settings, TV Link | Admins, with the TV Link add-on |
Read the day at a glance
Open Reports, then Daily Reports. The page opens on today.
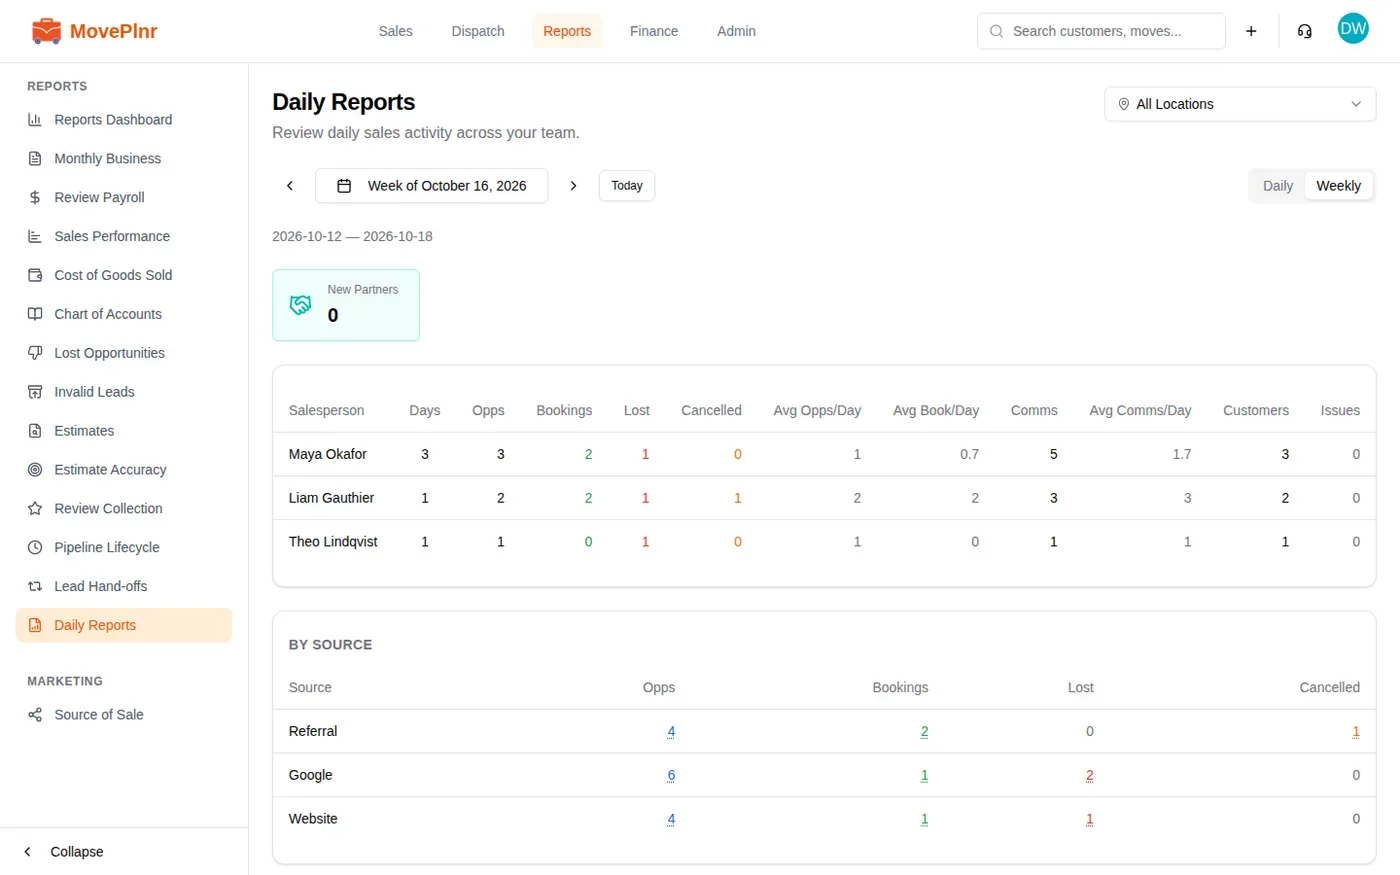
- Read the cards across the top: Opportunities, Bookings, Lost, Cancelled, Communications, Customers and New Partners. They add up the whole team for the day.
- Read the table below them. Each sales rep has one row, with the same numbers for that rep and the Status of their report: Open until they send it, then submitted. A note icon tells you they left notes.
- Use the arrows or the date button to look at another day. Today brings you back.
- Pick a branch in All Locations to see one location’s numbers.
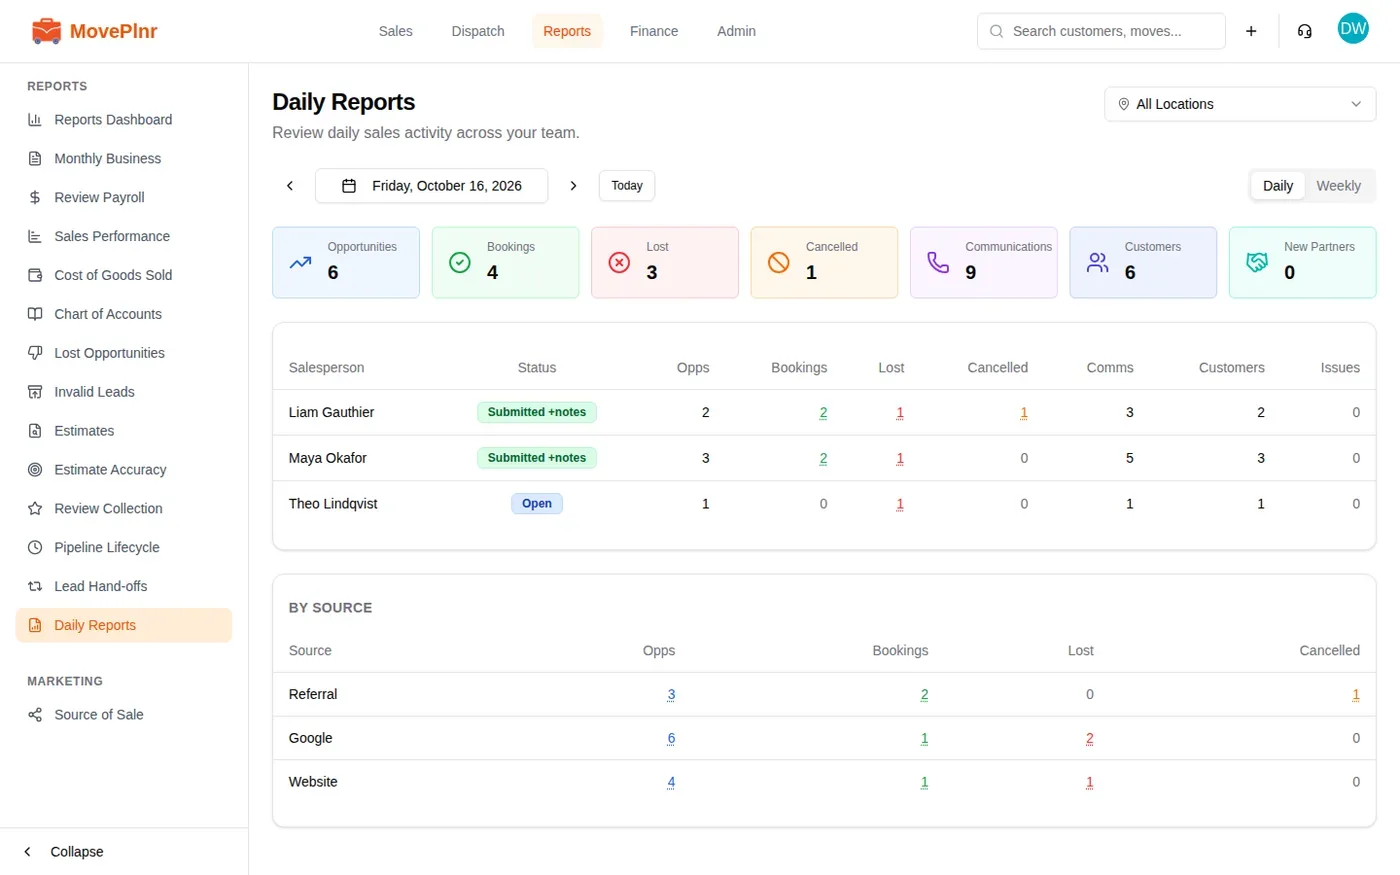
What each number counts:
- Opportunities: new leads that came in that day and are still open.
- Bookings: moves booked that day.
- Lost: leads marked lost that day, with the reason the rep gave.
- Cancelled: moves that were booked and then cancelled that day.
- Comms: calls, texts and emails with customers, including calls and emails a rep logs on a lead.
- Customers: how many different customers the rep reached.
- Issues: customers contacted with no lead attached, and leads with no activity in 7 days or more.
Look at one rep’s day
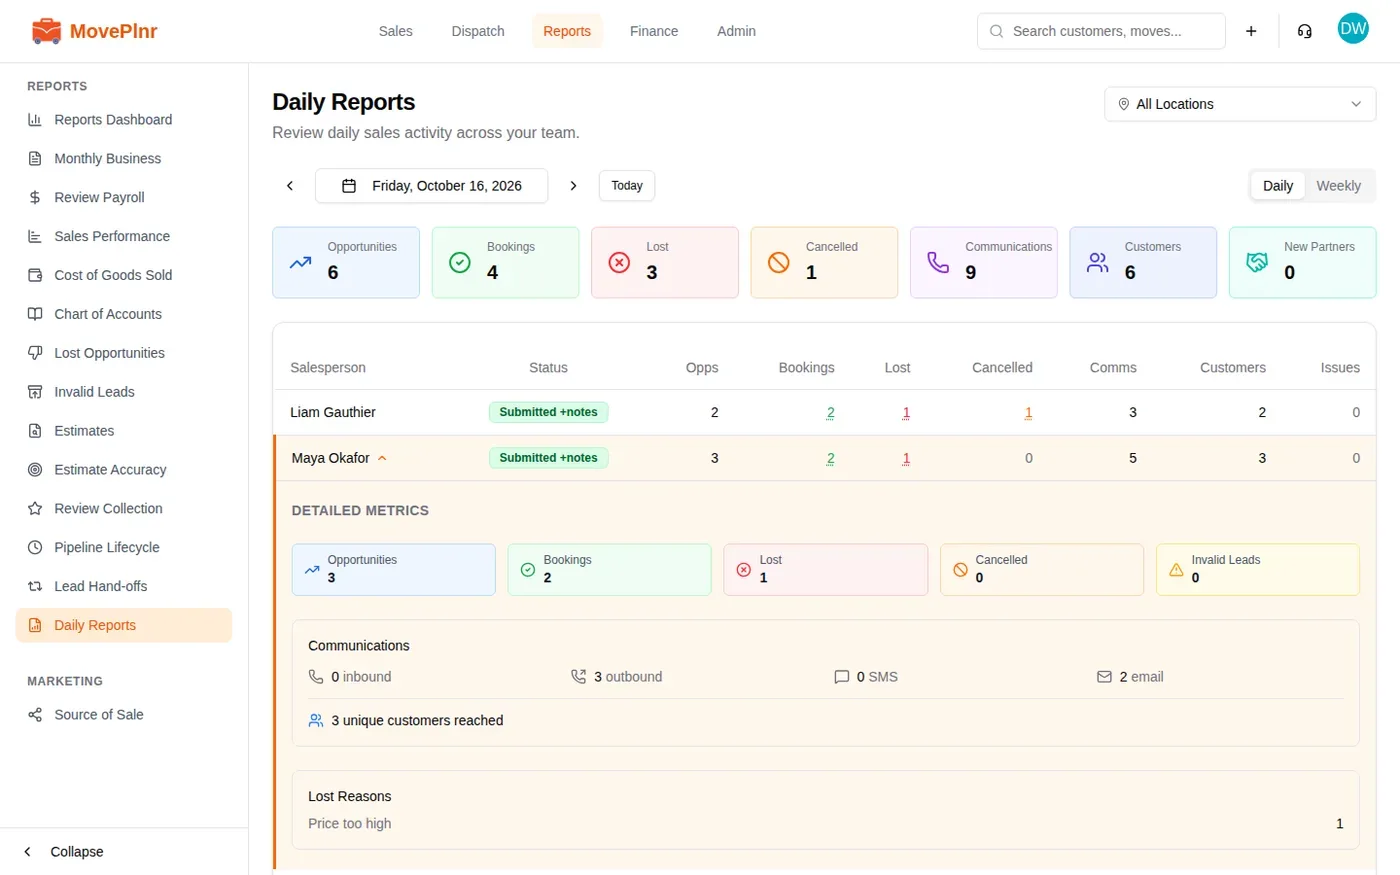
Click a rep’s row to open their detailed metrics: the same counts, then their calls in and out, texts and emails, how many customers they reached, and the reasons behind any lost deal. Click the row again to close it.
Drill into a number
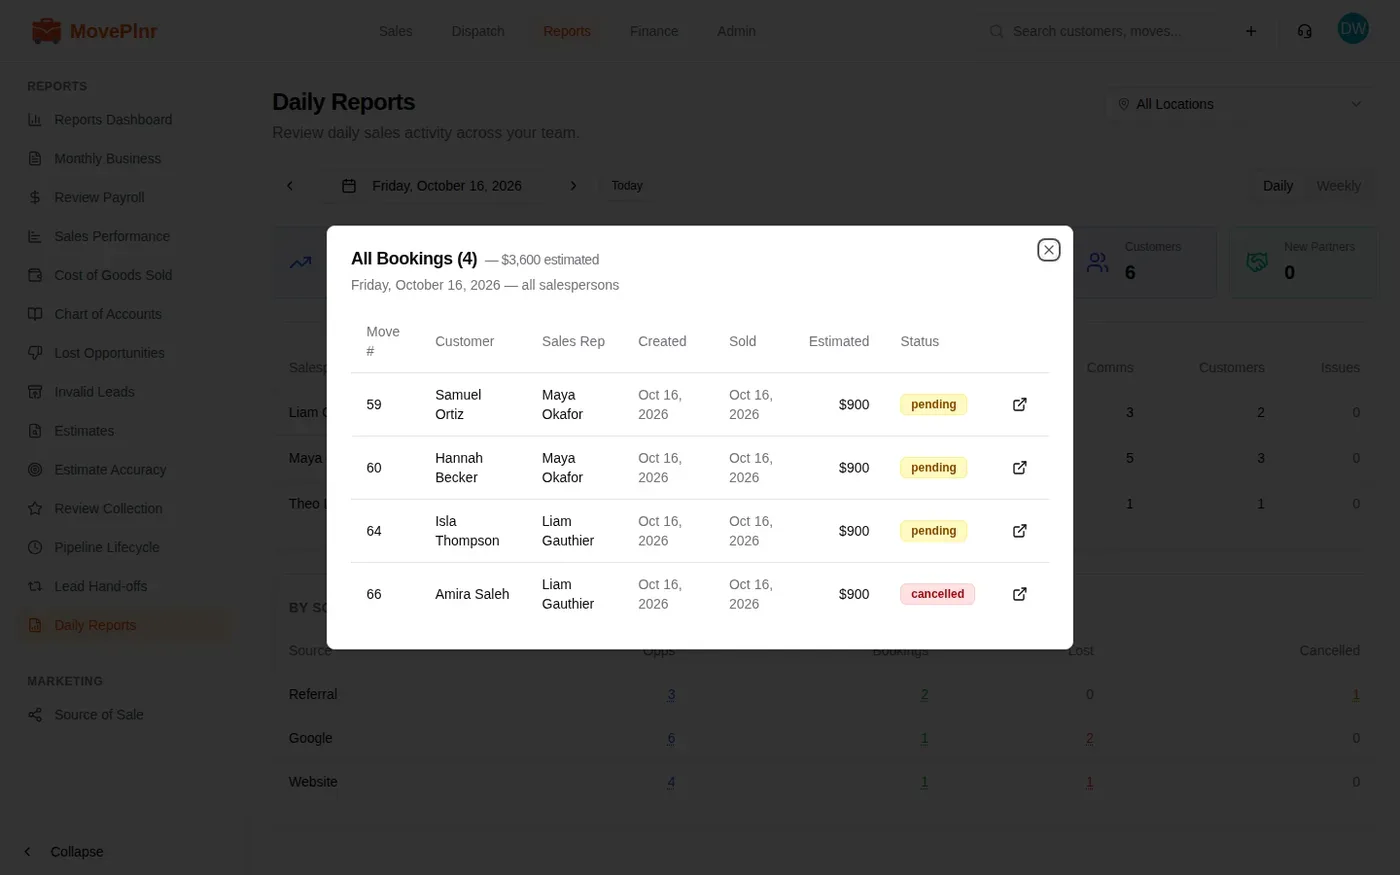
Any card or underlined number you can click opens the list behind it. Click Bookings at the top and you get every move booked that day: the customer, the rep, when the lead came in, when it sold, the estimate and where it stands now. The arrow at the end of a line opens that move.
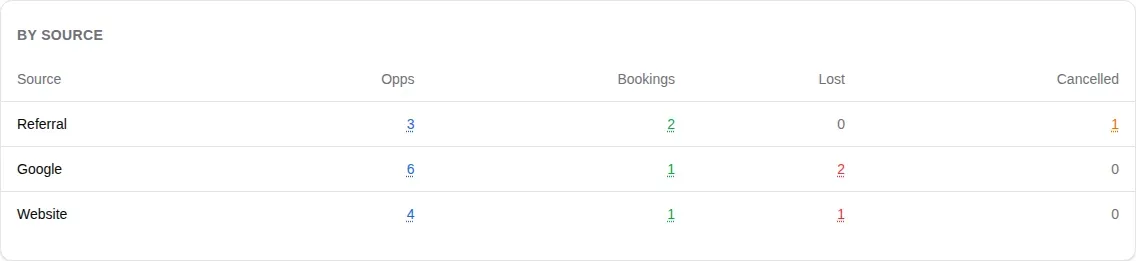
The By Source table at the bottom splits the day by where the customer came from. Its numbers open the same lists, filtered to that source.
A whole week
Switch from Daily to Weekly to see Monday to Sunday at once. Each rep’s row adds the days they reported and shows their averages per day: Avg Opps/Day, Avg Book/Day and Avg Comms/Day.
Submit your end-of-day report
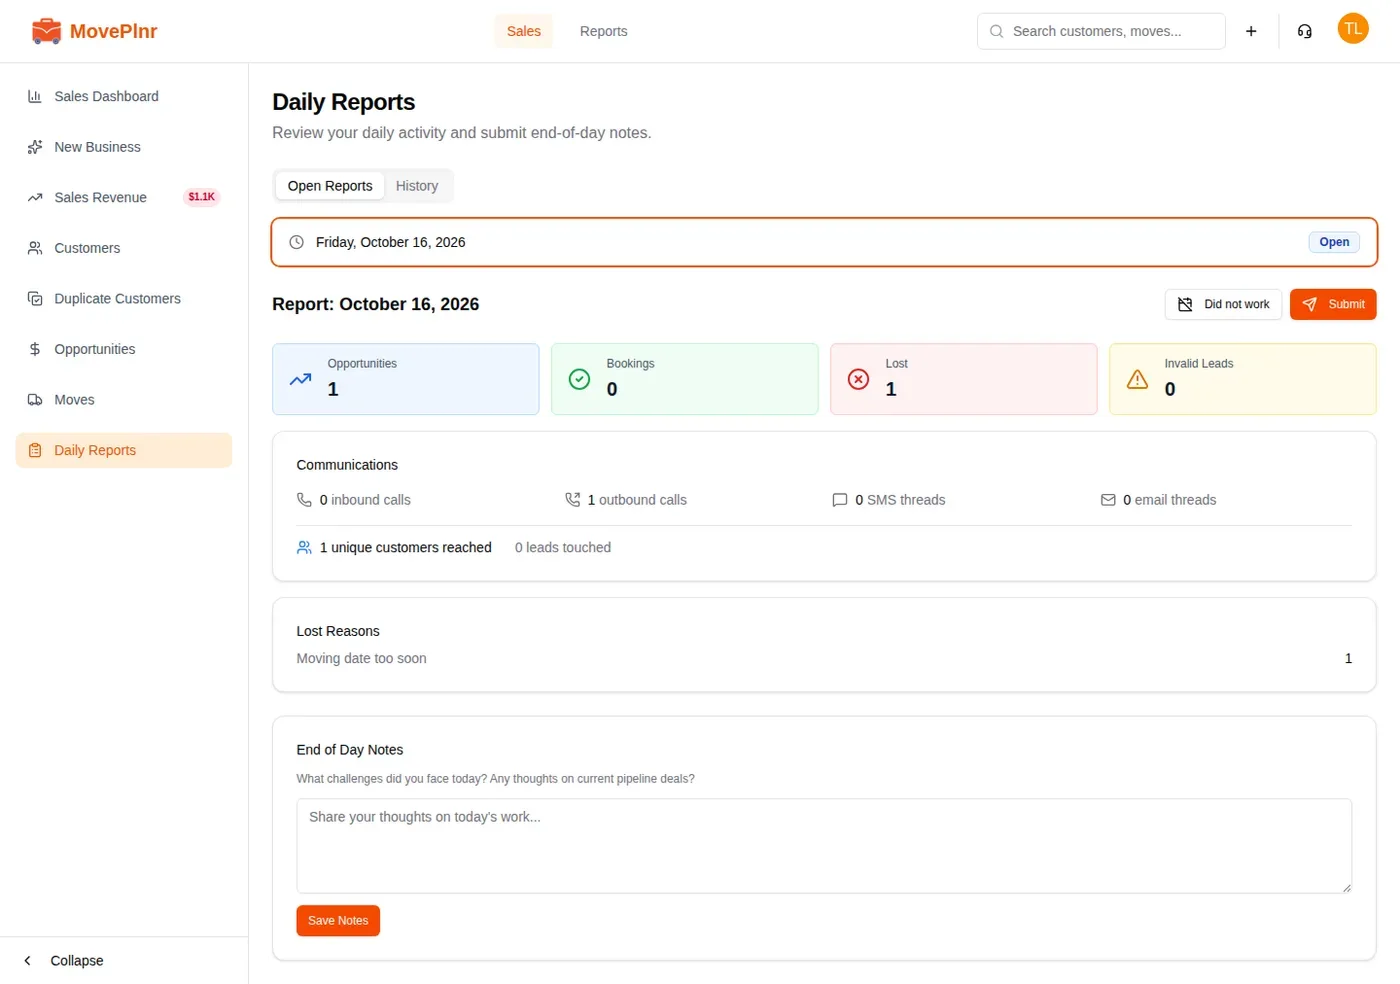
If you are a sales rep, your own report is under Sales, then Daily Reports. MovePlnr has already counted your day for you. All you add is a few lines.
- Under Open Reports, click today’s date.
- Check your numbers: opportunities, bookings, lost deals and your calls, texts and emails.
- Under End of Day Notes, write what got in the way today and how your open deals look. Click Save Notes.
- Click Submit. If you didn’t work that day, click Did not work instead.
When you submit, admins get a notification that links straight to your row on the dashboard. History lists your past reports, month by month.
Read the Monthly Business Report
Open Reports, then Monthly Business. Pick the month and the year at the top right, and a location if you have more than one. While the month is still running, the page says the report is not final.
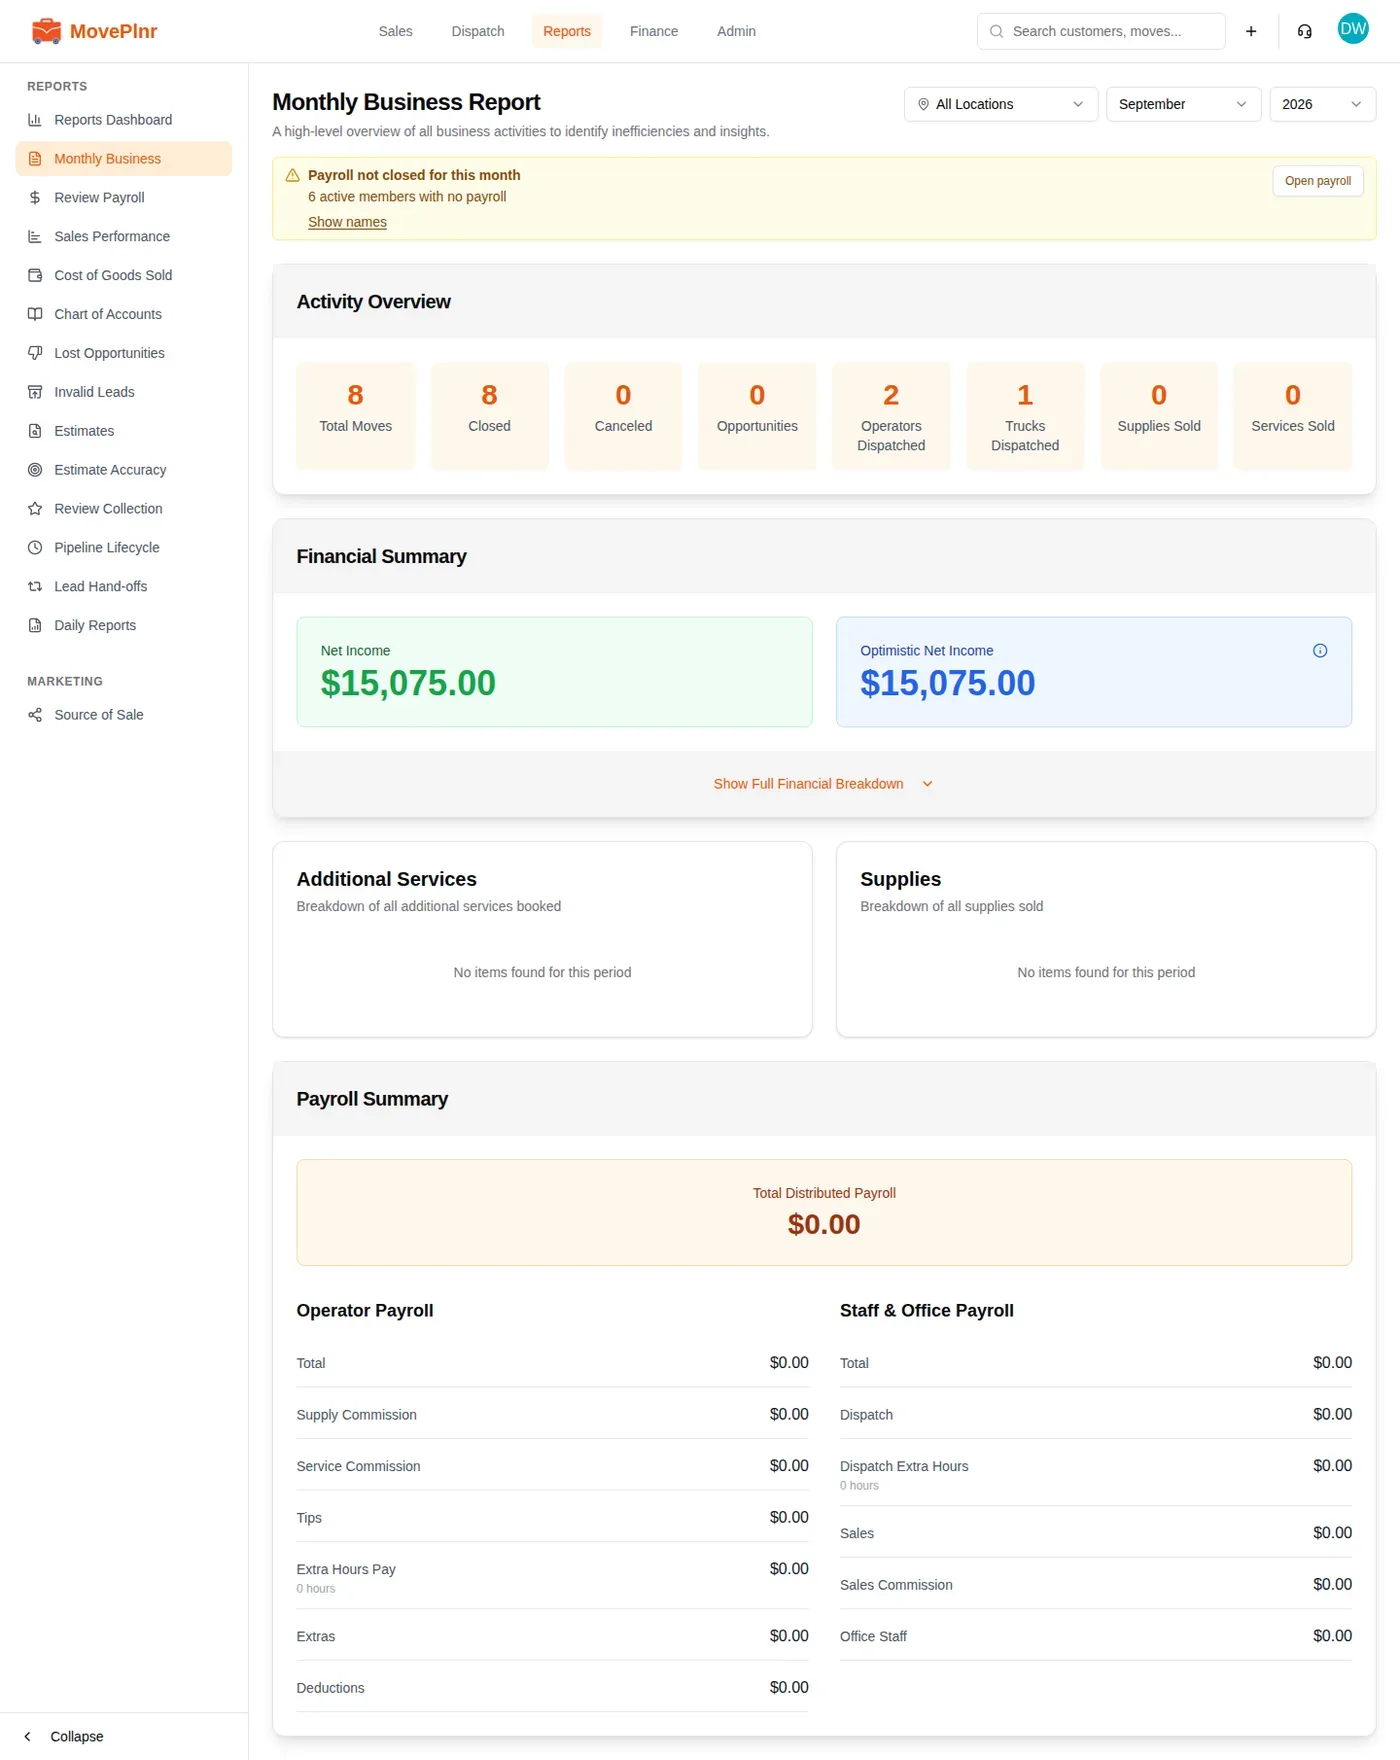
- Activity Overview counts the month’s moves by move date: total, closed, cancelled and open opportunities, plus how many movers and trucks went out and the supplies and services sold.
- Financial Summary shows Net Income, the money collected so far, and Optimistic Net Income, what you take in once every closed move is paid.
- Show Full Financial Breakdown opens the revenue lines, taxes, tips and Collections Status: what is collected, what is not, and what is overdue.
- Additional Services and Supplies chart what you sold. See details lists every move behind them.
- Payroll Summary splits the month’s payroll between movers and the office. If payroll for the month isn’t closed yet, a note at the top says so and links to it.
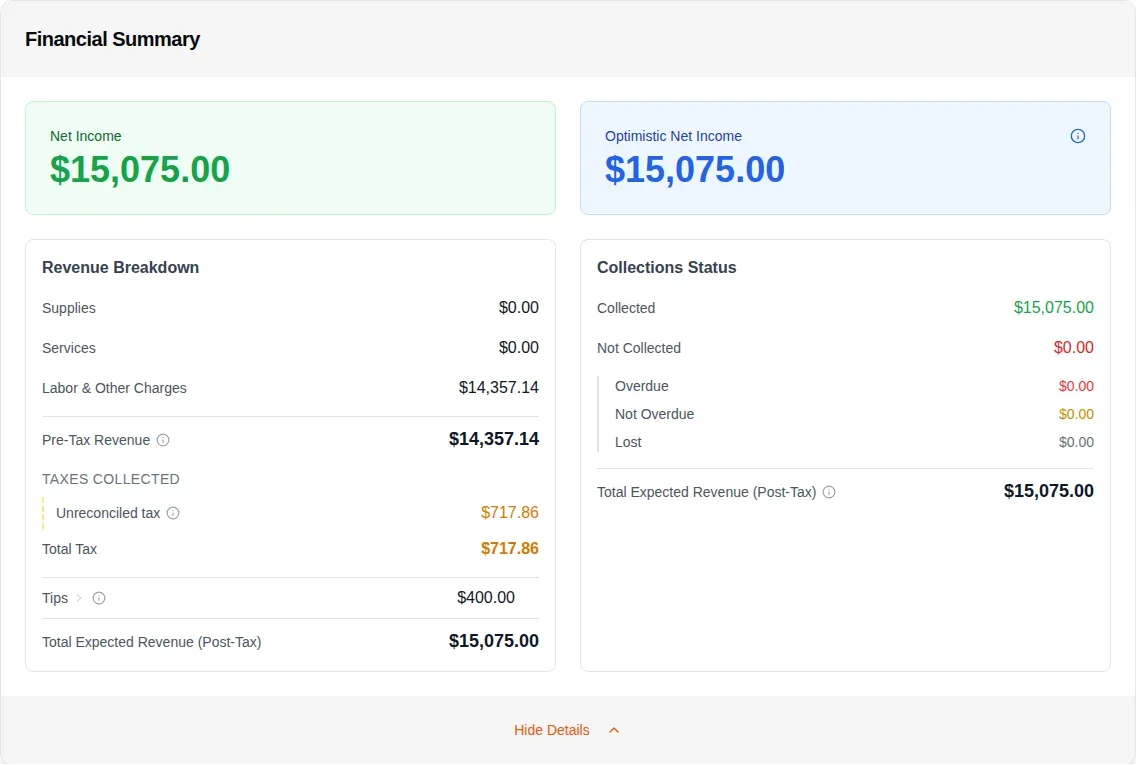
Click a tax line or Tips in the breakdown to see the moves that make it up, sorted by move date.
Put your sales numbers on the office TV
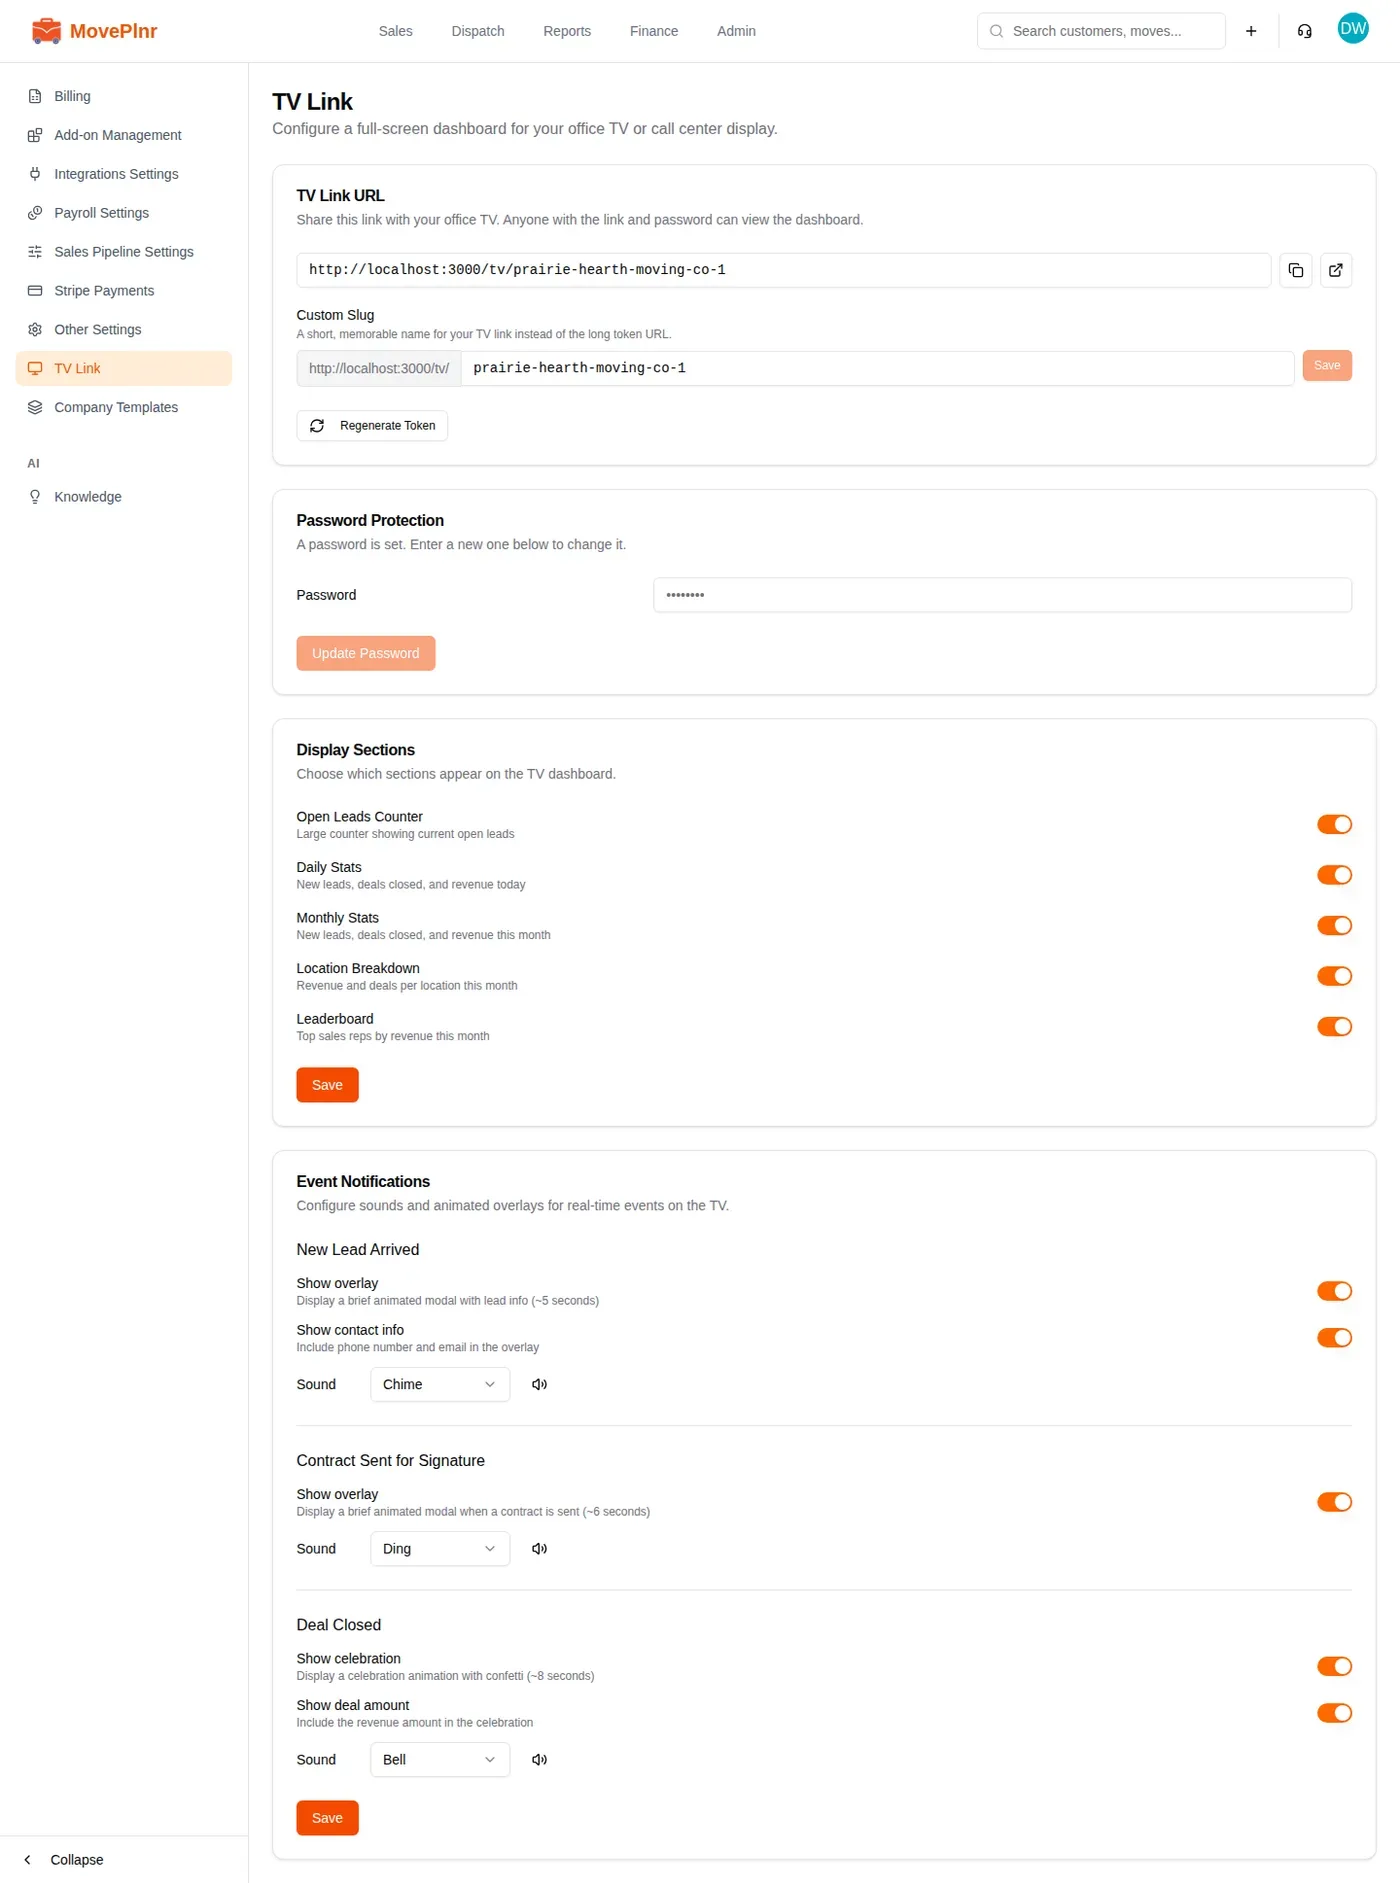
TV Link is a full-screen sales dashboard for a TV in the office or a call centre screen. It needs the TV Link add-on.
- Open company settings, then TV Link.
- Under Password Protection, type a password and save it with the button under it. The link does not open without one.
- Under TV Link URL, click the copy button. Open that link in the TV’s browser and enter the password. The TV remembers it.
- Under Display Sections, choose what the TV shows, then click Save.
- Under Event Notifications, choose a sound and an overlay for New Lead Arrived, Contract Sent for Signature and Deal Closed, then click Save.

The TV shows the leads nobody has picked up yet, today’s revenue, deals won and close rate, the same for this month, and a leaderboard of your reps. With more than one location it adds a tile for each. When a lead comes in, a contract goes out or a deal closes, it plays the sound and shows the overlay you chose.